Reports
NomadPOS gives you reporting tools you can use to analyse and investigate your business in real-time, from how your products are selling, to how customers are paying, and how busy your POS terminals are throughout the day.
Things to Consider - Understanding your Reports
- A report can be run for a specific location or all locations.
- Reports are located within customisable sub-menus. The default menu lists reports within Sales, Accountability, and Maintenance.
- Reports use fixed layout templates. All column headers and layouts are predefined.
- You can upload a logo to display at the top of every report.
- Transaction data is available in .xml and json export formats if your business has unique or custom reporting requirements.
- You can view, print, or export the report results.
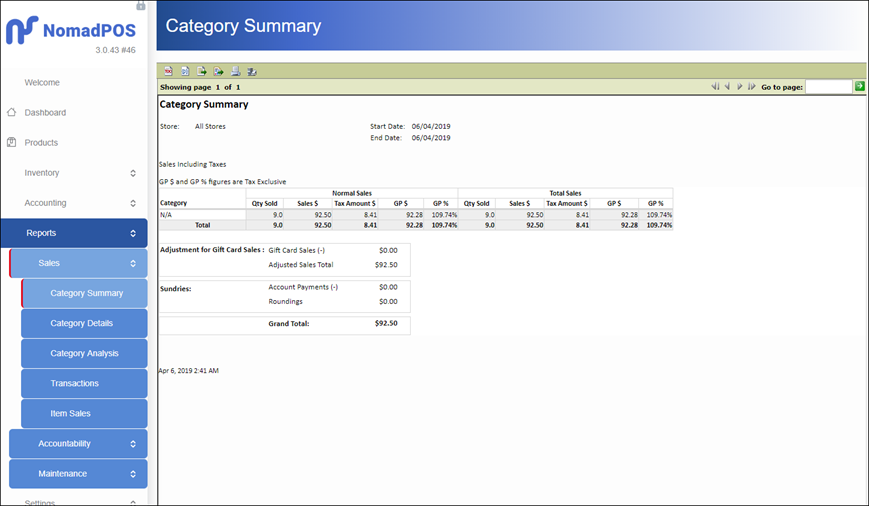
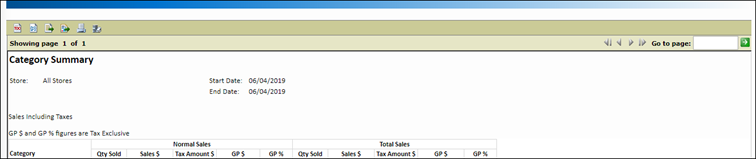
Sample Report
Reports Available
Sales
| Report | Report Content |
|---|---|
| Category Summary | Normal, promotional, and total sales in dollars and units, by department, for a selected date range. The Grand Total is the actual location total. This amount should balance to the Total Tendered amount on the Accountability reports. |
| Category Details | TTotal sales in dollars and units, by department, for a selected date range. Option to run for specific terminal/s and product/s. Useful to review daily sales by selling code. Run after the Category Summary report, if that reported a category which needs closer investigation. To see sales totals by range: set Show Range to [Yes] and Show Products and Show Sell Codes to [No]. |
| Category Analysis | Daily sales totals in dollars and as a percentage to the total for the day, by department, by day for a selected week. Option to show a Transaction Count on the report. |
| Transactions | Transaction totals for sales performed at POS between a selected date range. Sales are grouped by terminal, and show transaction number, tender type, transaction total, and tendered amount. |
| Item Sales | Itemised sales performed at POS between a selected date range at a selected store. Sales are grouped by category, and show transaction number, product name and barcode, comment entered, sell price, quantity sold, and total sale and tax $ amounts. |
Accountability
| Report | Report Content |
|---|---|
| Company Accountability | A one page location total of the POS activity and takings, customer count, and Total lifts and adjustments (cash, cheque, manual EFT). |
| Terminal Accountability | The activity and takings for each terminal, for a selected date range. Shows the number and value of transactions for each tender type. 'Cash' total is net of change and EFTPOS cashouts. These values may add up to more than the daily number of transactions, due to multiple tender types in the transaction. Total Tendered is the total of all tender types. This amount will balance with the Grand Total amount displayed on the Department reports. Adjusted Sales Total is the actual total sales amount. This amount will balance to the location Totals amount on the Department reports. |
| Transactions by Tender Type | View information related to the payment method/s used during POS transactions, so that it can be used for reconciliation purposes. Includes the Terminal, Operator, Transaction number, and any unique Reference for the payment (i.e. EFTPOS card type, account number, or gift card barcode). |
| Account Transactions | Useful for balancing account activity when account POS transactions occur. The report displays transaction information and the items purchased. The report groups sales by customer account number. |
Maintenance
| Report | Report Content |
|---|---|
| Cost Book | Cost-related details for all products, specific product/s, specific supplier/s, or products within a high/low margin range. Useful as a range report for a supplier, and to identify products with negative margin. |
Run a Report
- From the sidebar, click Reports.
- Expand a submenu to browse the available reports.
- Click the name of the report to run.
- Enter the parameters for the report.
If the parameters don't automatically load, click the TOC icon in the top ribbon. Parameters marked with * are required. - Click OK.
The report results display on the screen. The parameters you selected show above the report. Use page navigation at the top of the report to browse though a report that goes across multiple pages.
Refresh Report Data
- On the report results screen, click the Run Report icon at the top of the screen.
- Leave or change the parameters as required.
- Click OK.
The report fetches any new data available for your request, and loads the results on the screen.
Export Data
- On the report results screen, click the Export Data icon at the top of the screen.
- Select from the Available Results Set to show the columns you can export.
- Use the arrows to move the required columns into Selected Colunns; reorder them as required.
- Select the export formating options applicable to your needs.
- Click OK.
A file is generated at the bottom of your screen. The file can also be found in the downloads directory.
Export a Report
- On the report results screen, click the Export Report icon at the top of the screen.
- Select the Export Format:
Choose DOCX to open in Microsoft Word (2007 or later).
Choose XLSX to open in Microsoft Excel (2007 or later).
Choose PDF to open as a read-only document. - Confirm the Pages page range to export.
- Click OK.
A file is generated at the bottom of your screen. The file can also be found in the downloads directory.
Print a Report
To print as HTML or PDF:
- On the report results screen, click the Print Report icon at the top of the screen.
- Choose the Print Format and Pages for your request.
- Click OK.
The report opens in your chosen viewer, print option opens in a new window if you want to save the report.
To print to a network printer:
- On the report results screen, click the Print Report on the Server icon at the top of the screen.
- Choose the Printer, Settings, and Pages for your request.
- Click OK.